
3. The Accelerating Time to Market Cap
In our models, we divided the dataset into the three eras to see if the pace had changed over time. See Table 1. We weresurprised by how much it changed. Play Bigger analysis found that a typical company from Era 3 reached the $500 million market cap milestone almost three times as fast as the typical company from Era 1. See Figure 1.
|
MCAP Milestone |
Era 1 (2000-2003) |
Era 2 (2004-2008) |
Era 3 (2009-2013) |
Era 3 to Era 1 speed ratio |
|
$500 M |
4.5 |
2.3 |
1.6 |
2.8 |
|
$1 Bn |
8.5 |
3.5 |
2.9 |
3.0 |
|
$3 Bn |
24.6 |
8.3 |
7.9 |
3.1 |
|
$5 Bn |
n/a |
13.1 |
13.0 |
3.1 |
Table 1: The Accelerating Time To Market Cap
Shows the number of years it takes the "typical" company to reach certain MCAP milestones byEra. Era 3 is reaching TTMC milestones between 2.8 and 3.1 times as fast as Era 1
We have some understanding about why this is happening, with input from some of the leading investors and CEOs in Silicon Valley. Our short list of the key factors driving the accelerating Time To Market Cap include:
- New products and services get discovered and adopted at a speed never seen before, driven by the networked economy and always-on rich communication. Facebook wascreated in 2004; Twitter in Sites such as Tumblr, Pinterest, WhatsApp and overseasnetworks like Sina Weibo in China add to the dynamic.
- The iPhone, launched in 2007, ignited a smart phone revolution, and now five billion people carry a connected device. Distribution is cheap and global at the same time.
- Because of the fast spread of information, technology users come to understand that a problem(bad taxi service) can be solved with a new service (Uber). This creates a new category in consumers’ minds, while word quickly spreads about the leader who can address that category.
- Business models have evolved from perpetual licenses to subscriptions. This has reduced the barrier of entry for users and buyers dramatically. As a result, adoption happens faster. Freemium models only drive the adoption curves even faster.
- Services such as Amazon’s hosted web services have fundamentally changed the way companies create and deliver software applications. Start-ups no longer have to buy hardware or build data centers. The day Agile software development delivers a finished build, the product or service can go live to the world. That wasn’t true in the earliest part of this century. So fully-formed products and services can be globally launched and scaled faster than ever.
- The cost of distribution has reduced dramatically, thanks to networks and the cloud. That’s contributed to an overall reduction in the capital requirements of start-ups. This means there is more capital available on a proportional basis.
- CEOs have many more vehicles by which they can get funding well beyond the traditionalventure capital circles, including super angels, angels, crowd funding, and accelerators. As more money from more sources has become available, start-ups have invested big and fast to define and develop a category as quickly as possible.
- The emergence of the mega-round financing from crossover and hedge funds has created an abundance of available capital in the late stage market and enabled companies to delay their IPOs and continue to grow as private companies.
It would be easy to dismiss these fundamental drivers of business velocity and conclude that thisreport has simply chronicled another technology bubble.
We believe that our data about TTMC and Category Kings actually leads to the conclusion that we’re not in a bubble, but are in a time of shifting dynamics where more money flows to a few winners more quickly, and away from losers equally as quickly.
In all, while we see huge amounts of value being created, huge amounts are being destroyed, all at the same time. The industry looks like it’s in a bubble if you look at the money being pumped into companies early or at the value of Category Kings. The totality of the technology universelooks less like a bubble and more like an increasingly high stakes winner-take-all poker game.
Figure 1: The Accelerating Time To Market Cap
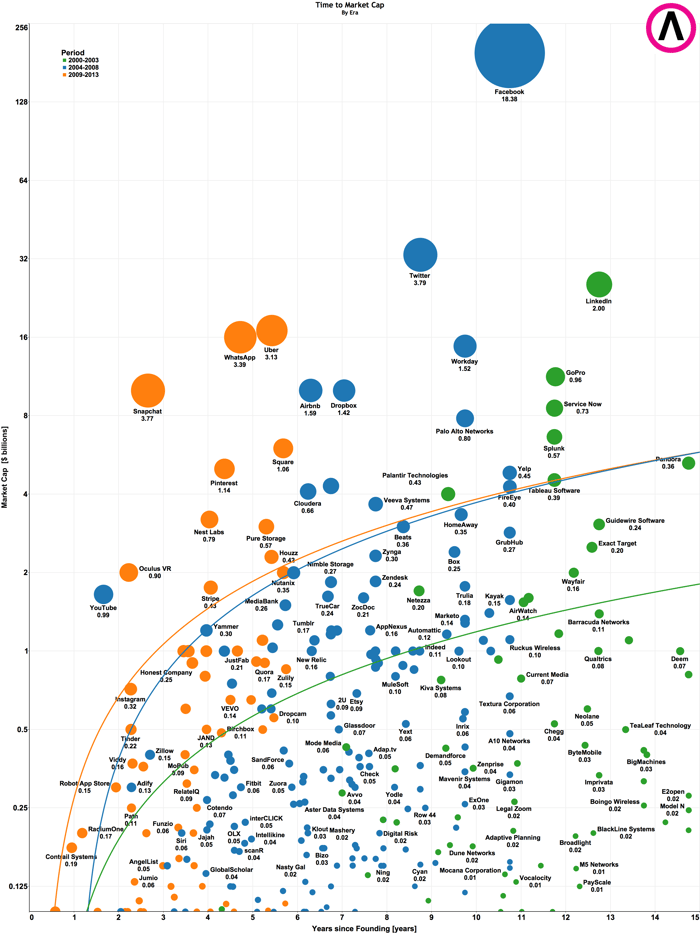
Individual dots represent the latest valuation of a company in the Market Cap/Time matrix. The size of the dot represents the MCAP Growth Rate of the company. The number under the company name is the MCAP Growth Rate in $ Billions / year. The yellow, blue and green lines areTTMC Models for a “typical” company from each era. The rising trajectories of these TTMC Modellines indicate a faster TTMC for each era.
4. Consumer vs. Enterprise
All the discussion about accelerating TTMC invited another question: Is there a difference in TTMC by category of company?
We classified companies in our study as either consumer (B2C) or enterprise (B2B). If a company has a mixed business model, we classified it as enterprise.
We found that consumer companies had a much faster TTMC than enterprise companies by a wide margin. See Figure 2.
By breaking out consumer and enterprise companies, we also sought to answer the question ofwhether the faster TTMC of consumer companies was skewing the whole pool of companies, and making it seem like enterprise companies were experiencing the same dynamic when they weren’t.
However, when we pulled out enterprise companies, we were surprised to see exactly the same phenomenon, though stretched over longer time periods. So within the enterprise group, while not as fast as for consumer, were enterprise companies where TTMC was still accelerating, with enterprise companies reaching $500 million almost twice as fast for Era 3 compared with Era 1.See Figure 2a.
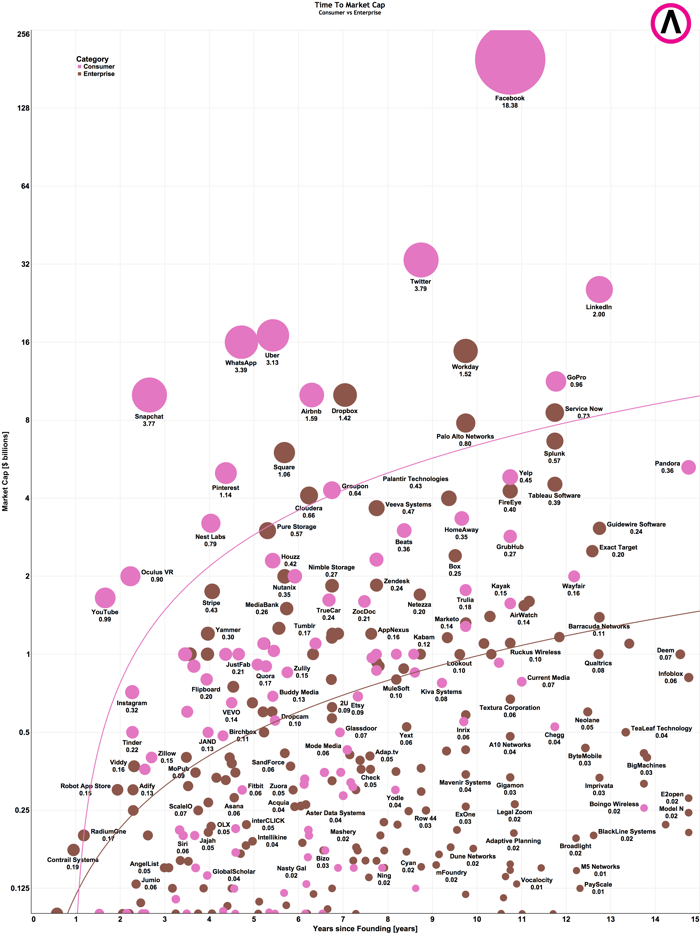
Figure 2: Consumer Companies Have a Faster TTMC than Enterprise Companies.
Individual dots represent the latest valuation of a company in the Market Cap/Time Matrix. The size of the dot represents the MCAP Growth Rate of the company. The number under thecompany name is the MCAP Growth Rate in $ Billions / year. The pink line is a TTMC Model for a“typical” consumer company and the brown line is a TTMC Model for a “typical” enterprise company. The higher trajectory of pink line indicates a faster TTMC for consumer companies.
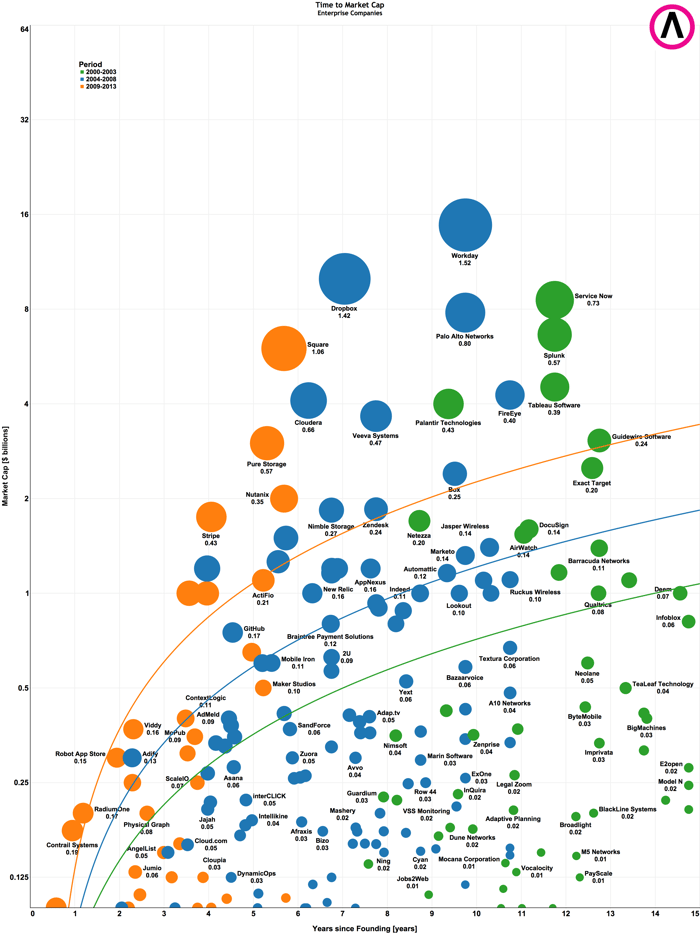
Figure 2a: Time to Market Cap has Accelerated for Enterprise Companies
Individual dots represent the latest valuation of a company in the Market Cap/Time matrix. The size of the dot represents the MCAP Growth Rate of the company. The number under the company name is the MCAP Growth Rate in $ Billions / year. The yellow, blue and green linesare TTMC Models for a “typical” enterprise company from each era. The rising trajectories ofthese TTMC Model lines indicate a faster TTMC for each era.
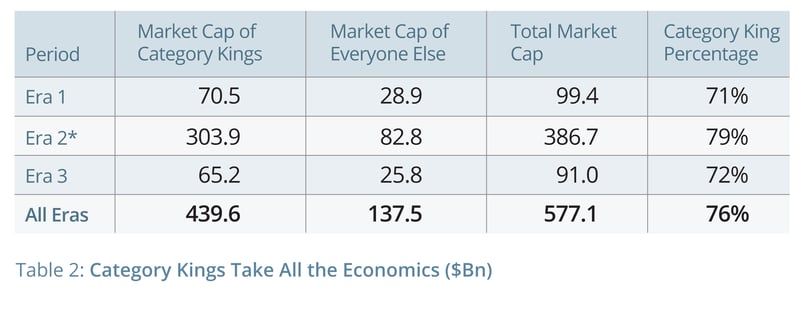
5. Category Kings Take All the Economics
Among all the companies in our study, we identified 35 companies that dominate the rest of their competitors in a particular market. We call these companies Category Kings.
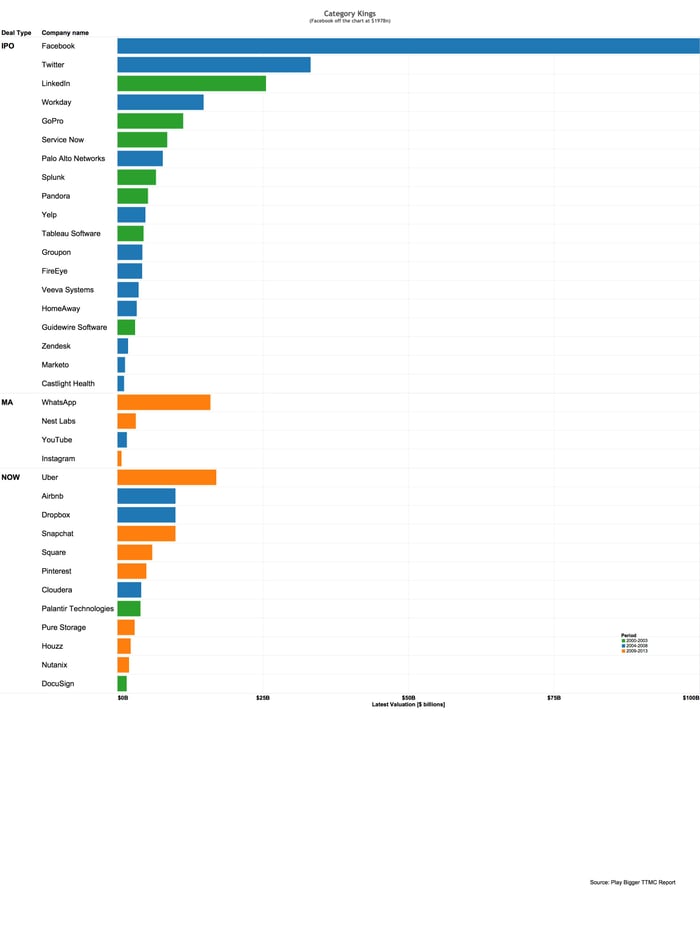 Figure 3: The Category King List
The Companies are shown with their current valuation. We broke them down into companies that have gone public (IPO), companies that were acquired (MA), and companies that are still private (NOW).
We selected these companies based on foundational category design principals:
- Category Potential – the number of people or enterprises that would be positively impacted by the company’s product or service and how much the market expands if the company’s future vision happens.
- Category Outcome – how well the company uses its Point of View to define the categoryproblem, how its solution solves that problem, and why the target audience for thatcompany should
- Category Appform – how well the company has built and architected its products and offers in a manner that would allow it to deliver the leading applications and platform for a category. The architecture must scale with explosive growth as the company rapidly expands its market.
- Category Blueprint – how well the company has articulated its vision for its solution and offersincluding current products, betas, and Also, how well the company depicts a future state and defines the entire solution that customers will demand from the leading company in the category.
- Category Ecosystem – the size and virility of the third party developer community who arebuilding applications, solutions and services on and around the company’s
As we sliced the data this way, it became obvious that one company, a Category King, takes all the economics in a particular category, leaving scraps of market value for the lesser competitors in that space. It also became clear that Category Kings are dominating the entire technology industry, since Category Kings as a group are capturing around 76 percent of the total value of all companies that met our study’s criteria, which is almost all VC funded companies since 2000. See Table 2.
|
Period |
Market Cap ofCategory Kings |
Market Cap of EveryoneElse |
Total Market Cap |
Category King Percentage |
|
Era 1 |
70.5 |
28.9 |
99.4 |
71% |
|
Era 2* |
303.9 |
82.8 |
386.7 |
79% |
|
Era 3 |
65.2 |
25.8 |
91.0 |
72% |
|
All Eras |
439.6 |
137.5 |
577.1 |
76% |
Table 2: Category Kings Take All the Economics ($Bn)
Category Kings take more than 70 percent of the Market Cap. By Era and overall.
* Facebook skews the Era 2 data due to their “outsized” MCAP.
We had a reason to sort the data for Category Kings. We have believed for years that the most successful start-ups become Category Kings and bury the competition. Many of the best and brightest VCs, investors and entrepreneurs had come to believe this too.
The industry has been able to cite anecdotal proof by pointing to great Category Kings such assalesforce.com and Uber. But no one had data-driven empirical proof, mostly, we suspect, because the underlying data was never there to analyze. Now, greater transparency in private fundings in recent years has given us the data. It just took someone like us to pull it together and look at it this way.
A common phrase in technology, ‘There’s room in this market for several players’ seems to be utterly false. The data shows that there’s room in any well-defined category for one super successful player and a bunch of companies that wind up as category serfs, and those that just die.
A few Category Kings get acquired, like WhatsApp and Nest, but most stay independent and quickly become too large to acquire. Most acquisitions are an incumbent company buying a category serf to try to get in the game. Almost all of those acquisitions go for less than $1 billion, and represent less than 5 percent of the aggregate value of the Category Kings.
Category Kings are more valuable than all the other companies in our study combined. They see MCAP Growth Rate of almost $1.6 billion per year and often reach a market cap of $5 billion in a few years. Many reach $10 billion in just under seven years.
As Time To Market Cap speeds up, the data shows winners win faster than ever, which means that losers lose faster than ever. With this increase in TTMC, categories get sorted out in a couple of years and there is very little time to pivot, especially in consumer technology.
We define losing as the moment where a company loses its ability to become the Category King as defined by flattened or shrinking valuations or market cap and slowed growth.
If a company has a market cap of less than $500 million and has been operating for more than six years, the likelihood that they become a Category King is very low.
6. Category Kings and Billion Dollar Kingdoms
We found 83 companies with a valuation of $1 billion or more. Almost half of these companies, and all of the largest billion dollar kingdoms, are Category Kings.
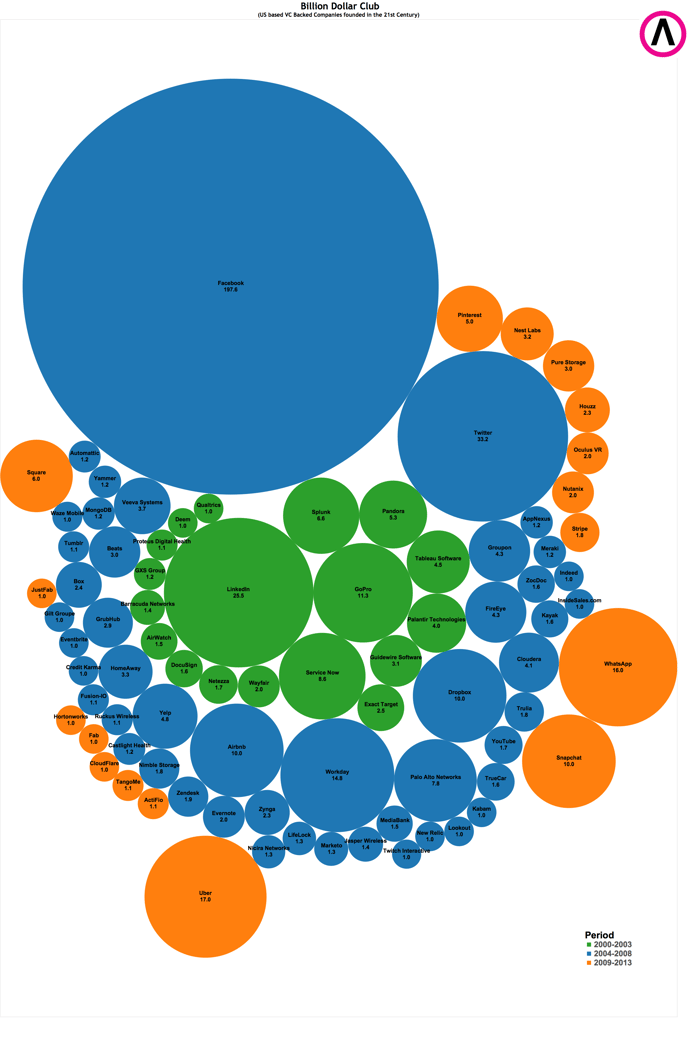 Figure 4: The Play Bigger Billion Dollar Club of 2014
7. Play Bigger Pirate Index
(The Wanna-Be Category Kings Who Got Bought)
At Play Bigger, we celebrate pirates, dreamers and innovators. So we couldn’t help ourselves. Wecreated a Pirate Index to celebrate the greatest pirates who didn’t stay independent, but still made a huge impact. In this context, we define a pirate as a founder who builds and then sells his or her company.
The Pirate Index is calculated by dividing the valuation by the number of years since founding. The outsized winner might not be surprising, but take a look at the rest.
Four companies created more than $500 million in market cap per year of operation with one company (WhatsApp) experiencing MCAP Growth Rate of more than $3 billion per year of operation.
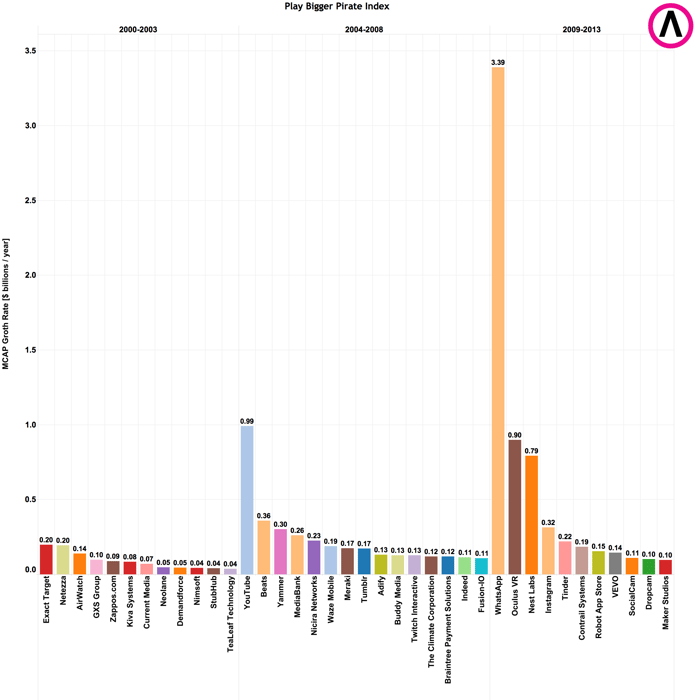
Figure 5: Pirate Index
A list of the top companies who were acquired ranked by the value they were acquired for divided by the number of years they have been in business.
We were also interested in who acquired these companies and it was no surprise to find that the Category King companies were the leading acquirers. We believe that Category Kingsexpand their Category Potential by making M&A moves into adjacent markets or acquiring core technology to expand their Category Blueprint.
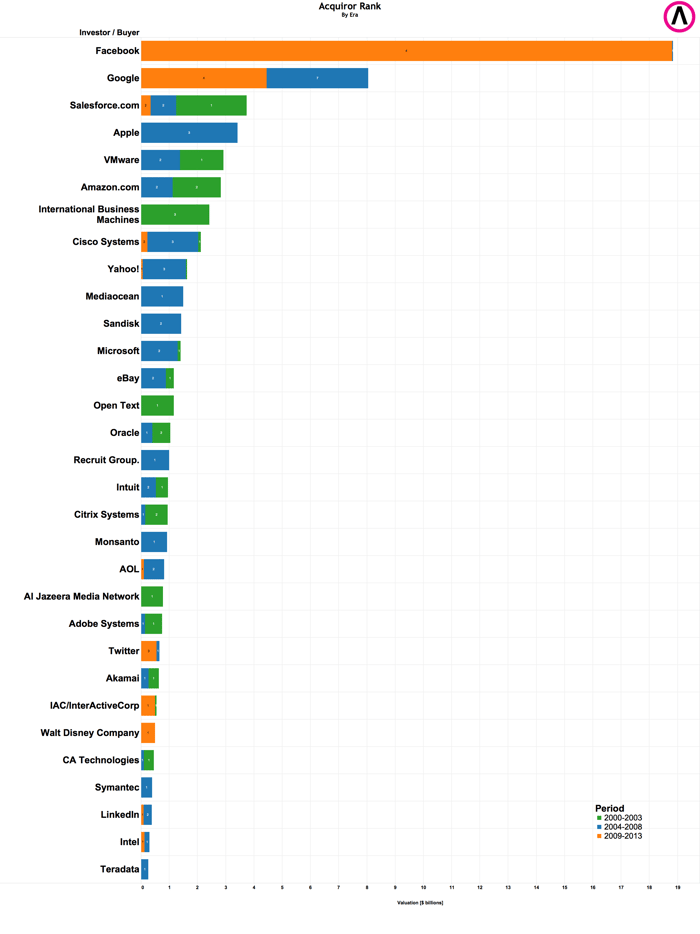 Figure 6: Category Kings Do All the Buying
A list of the leading acquiring companies ranked by cumulative acquisition value of the companies they acquired.