Skip to content

6-10 Law

A Category Design Research Report by Al Ramadan, Dave Peterson & Lucas Ramadan
Play Bigger Advisors, LLC.

INTRODUCTION

As we describe in our book “Play Bigger“ we developed a link between a category-based
strategy and brain science by studying market caps of public companies.

We recently published an updated excerpt from chapter two discussing the category lifecycle
and the brain science driving purchase behavior.

OUR ORIGINAL RESEARCH

In our original research we analyzed the total value created by every technology IPO from 2000
to 2015, and found something remarkable. We found a consistent “IPO sweet spot”. The data
shows that the best time for a tech company to go public is when it is between six and ten years old. We call this the 6-10 Law - see Figure 1.

6-10 LAW FIGURE 1-01

Figure 1 // 6-10 Law

The Harvard Business Review took this research and published an article in their Jan 2016 HBR magazine. A number of notable industry commentators including Bill Gurley from Benchmark Capital and Mike Maples from Floodgate helped kick start a rich dialog between founders and entrepreneurs along with the broader venture capital, banking and public investor communities. The debate and response motivated us to do further research on this topic.

2017 EDITION OF OUR RESEARCH

We asked our friends at PitchBook to provide data for companies who:

  • were founded since 2000
  • are venture backed
  • have a headquarters in the United States
  • completed an Initial Public Offering (IPO)
  • and meet our “tech” selection criteria (see methodology section at the end).

    We examined the market cap created post IPO. This is defined by the market cap increase (or decrease) from the market cap at IPO compared to the market cap as of December 31, 2016. We call this the Delta MCAP. We relate the Delta MCAP to the age of the company at IPO.

Of the 20,161 American venture-backed technology companies who have raised venture financing, 217 made it to IPO and 163 are still independent public companies as of December 31, 2016. These companies created $407 billion in market cap after their IPO’s. Here’s how they stacked up – see Figure 2.

6-10 Law FIgure 2-02

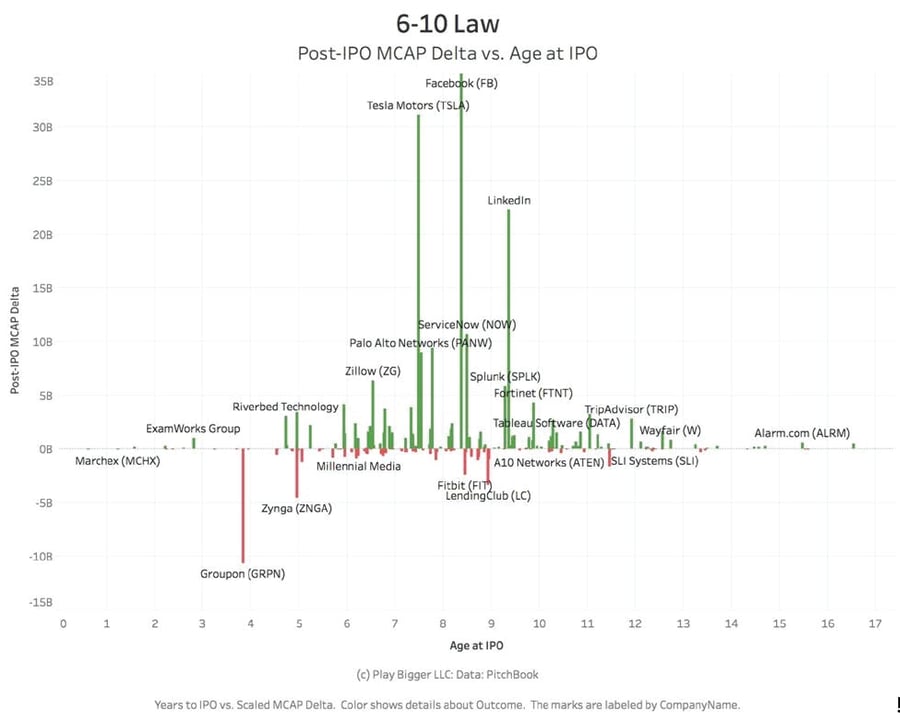
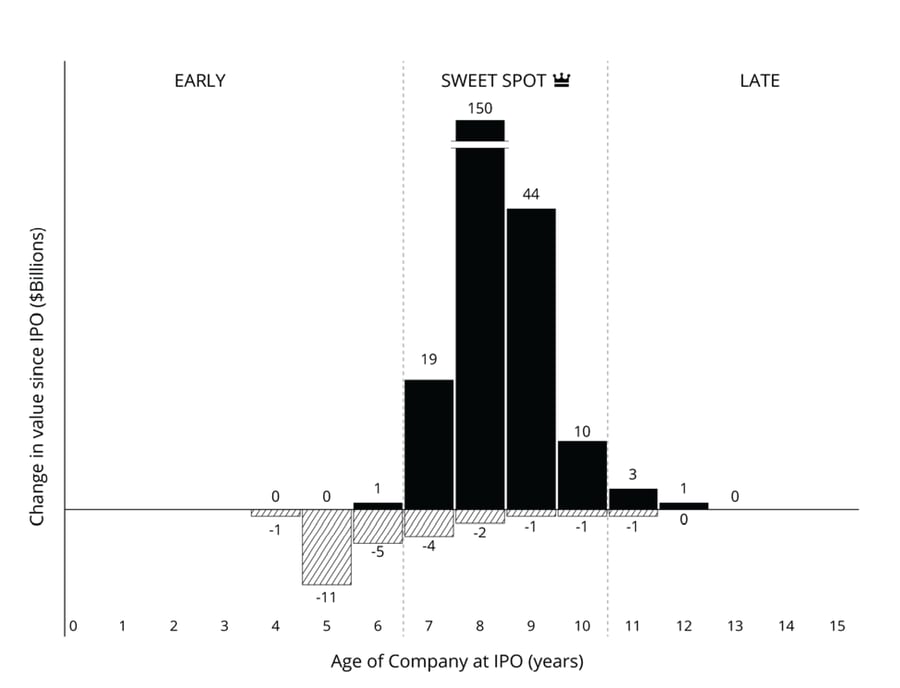
Figure 2 // IPO Sweet Spot Report

If you aggregate all these companies by their age (rounded to the nearest year) you find a pretty clear sweet spot between the age of 6 and 10 years.

See Figure 3.

Figure 3-03

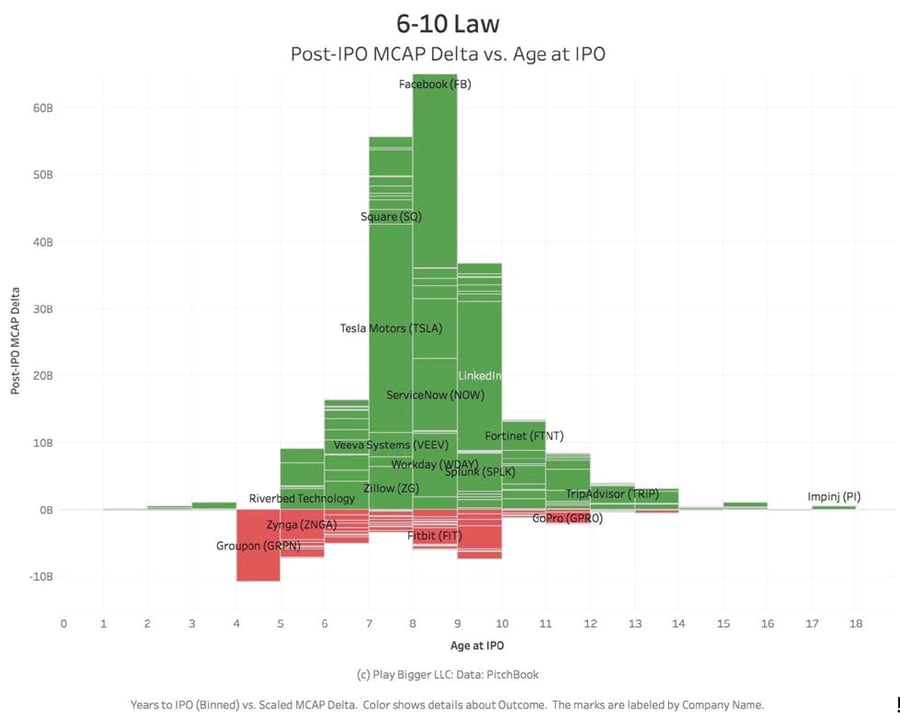
Figure 3 // 6-10 Law, 2017 Edition

Viewed cumulatively, companies that went public between the age of 6-10 years of age created 92% of the market cap created post IPO – See figure 4.

Figure 4-04

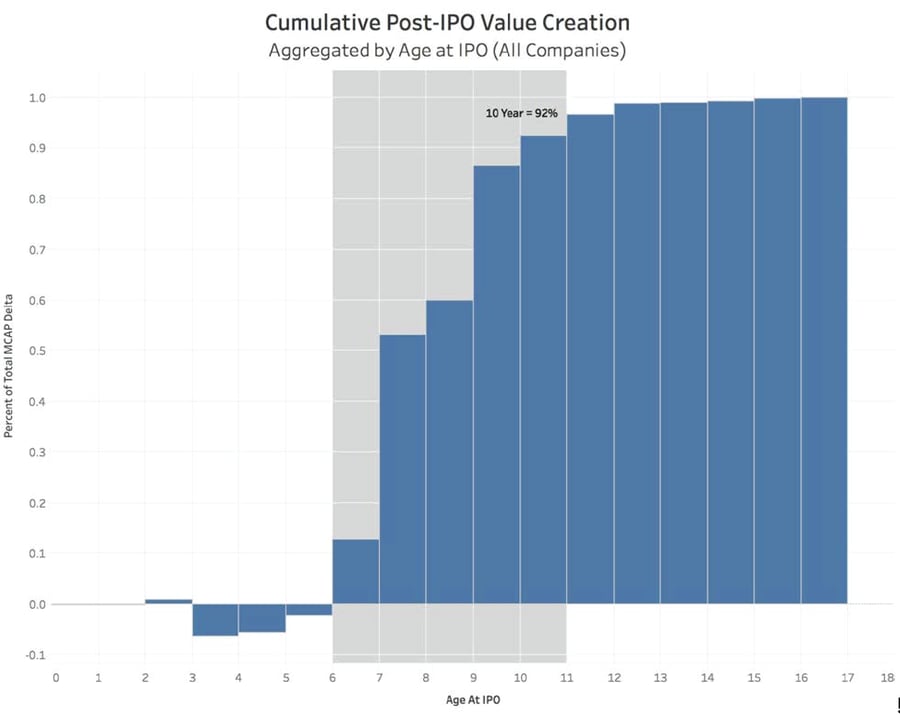
Figure 4 // Cumulative Value Creation Versus Age of Company at IPO

One of the questions that arose out of our original work was whether this phenomenon was the same for consumer and enterprise companies? The answer is yes. One thing we have observed is that consumer companies have a tendency to go public earlier than enterprise companies. See Figure 5.

Figure 5-05

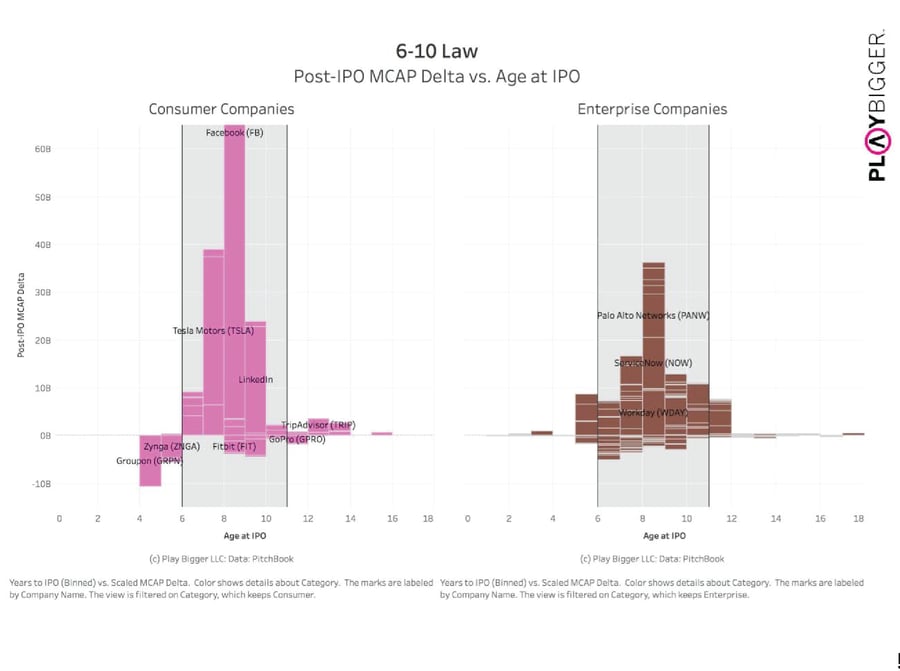
Figure 5 // Consumer Versus Enterprise

In our lectures and consulting practice we are often asked why the 6-10 law exists.

We believe that if you understand the natural evolution of categories, the cycles of technology adoption, and how your brain works, you find a natural connection between them.

What does all this mean for a CEO, founder, or category creator of any kind? Your number one job is to change the way people think. Your product, your company culture, your marketing— everything has to be aligned with transforming the way potential customers think. If you change the way they think, they will change their buying behavior. More importantly, if you are the company that changes the way people think, people will see your company as the category king, and you will win the majority of the customers.

Category thinking works because it’s the way our brains work. More importantly, it’s the mode of thinking that our brains turn to when faced with exactly the kind of overstimulated, crazy-ass marketplace we have today and will have in spades in coming years.

METHODOLOGY

Data Source and Selection

All Data utilized throughout this study was obtained from PitchBook, via extracts gathered by their support team.

We began by collecting data on companies that were VC-Backed, with headquarters in the United States, founded since 2000. Companies that were within PitchBook’s “Universe” of “Venture Capital” met this VC-Backed condition.

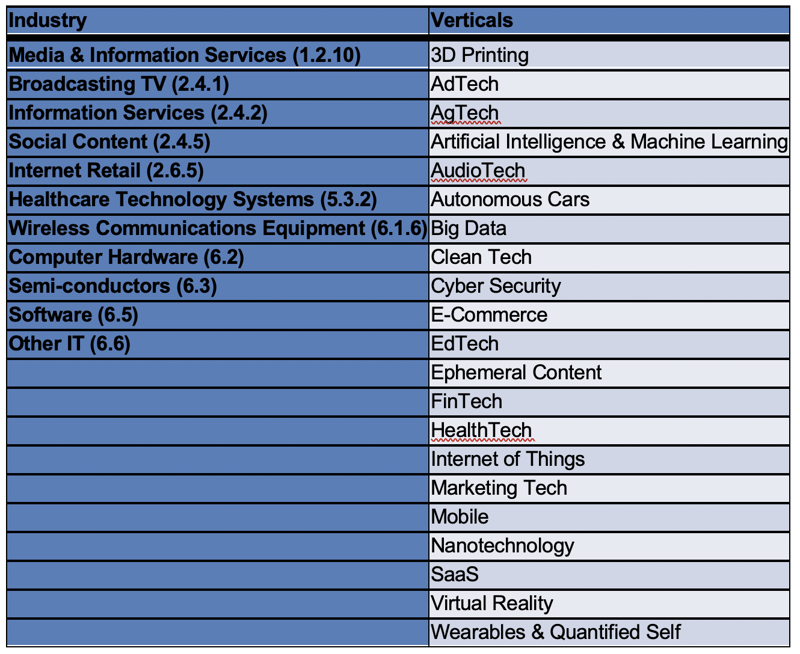
Companies were then only incorporated if they fell within our definition of a technology company, which meant that they needed to fall within at least one of PitchBook’s “Industry” or “Verticals” conditions. The conditions were selected through careful inspection of the companies, and iterative tuning of the conditions. Verticals included were intentionally kept broad.

Screen Shot 2022-07-19 at 4.22.04 PM

Finally, companies were only kept if they made it to IPO.

Data Enrichment

In order to examine and create the “6-10 Law” graphic, two measures were required: Age at IPO, and MCAP Delta.

From the conditions described in the section above, an extract was obtained that contained 217 companies that made it to IPO. Of the 217 IPO companies, 203 had IPO Valuation data, which was a required field for our analysis.

The “Current Valuation” of the company was then obtained with some basic logic: First, check for Public MCAP Valuation, and if none is present, check the Latest Deal Type. If the Latest Deal Type was a “Merger/Acquisition” (M/A), the Current Valuation is the M/A Valuation. If the Latest Deal Type was a “Buyout/LBO” or “Bankruptcy: Liquidation”, the Current Valuation is the corresponding Valuation. If a company did not have a Current Valuation field after the above logic, it was discarded, as there is no way to further analyze it, regrettably. Arguably, these missing companies were small IPOs/Current Valuations, which means their impact on the aggregate measures in our analysis were minimal. However, this is merely conjecture and is unsubstantiated.

Finally, the MCAP Delta field was calculated as the difference between the Current Valuation and IPO Valuation.

Of those 203 companies that had IPO Valuation data, 193 had Current Valuation, Founding Year and Date at IPO data. These 193 companies were the final subset utilized for our analysis.